XyMatrix Commutative Diagram
XyMatrix lets you create commutative diagrams — grid-based diagrams with cells and arrows connecting them. These are widely used in mathematics (algebra, topology, category theory) to show relationships between objects.
Inserting an XyMatrix
Section titled “Inserting an XyMatrix”- Place your cursor in the document.
- Type
\xymatrixin the suggestion box (or use the diagram selector in the items bar). - Select \xymatrix — XyMatrix (Comm.) from the dropdown.
A configuration dialog opens where you build your diagram.
The Configuration Dialog
Section titled “The Configuration Dialog”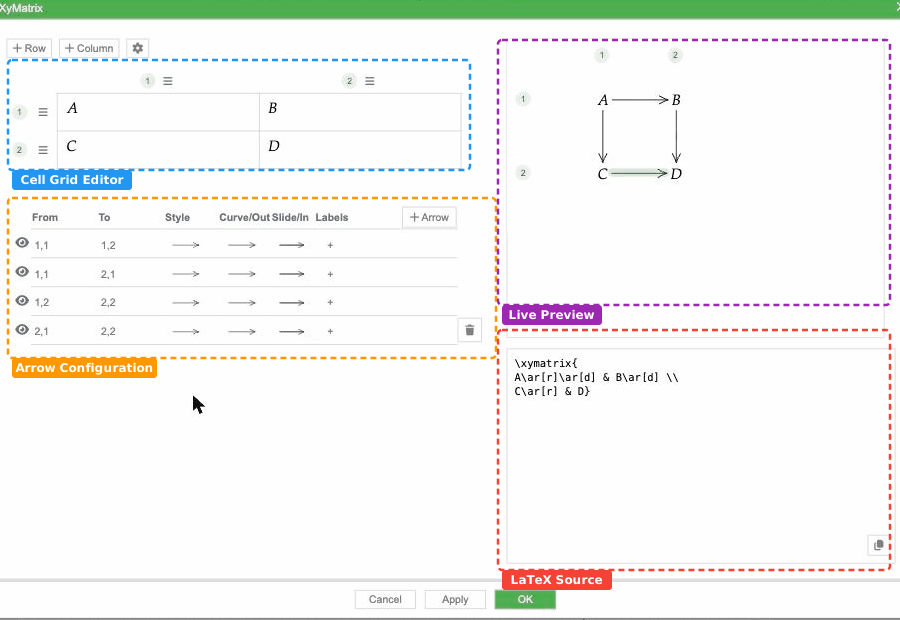
The dialog has four main areas:
- Cell Grid Editor — edit the content of each cell (supports math expressions)
- Arrow Configuration — add and configure arrows between cells
- Live Preview — see how your diagram looks as you build it
- LaTeX Source — view and copy the generated
\xymatrixLaTeX code
Editing Cells
Section titled “Editing Cells”Each cell in the grid is a math editor. Click any cell to type math content (variables, expressions, symbols).
Use + Row and + Column buttons at the top to expand the grid. You can also reorder rows and columns by dragging the handles (≡) next to the row/column numbers.
Adding Arrows
Section titled “Adding Arrows”Click + Arrow to add a new arrow. Each arrow has:
| Setting | Description |
|---|---|
| From / To | Select source and destination cells by their row,column position |
| Style | Choose the arrow appearance (see styles below) |
| Curve/Out | Control arrow curvature — straight, curve up, or curve down |
| Slide/In | Offset the arrow above or below its default position |
| Labels | Add text labels above, below, or in the middle of the arrow |
To remove an arrow, hover over its row and click the trash icon.
Arrow Styles
Section titled “Arrow Styles”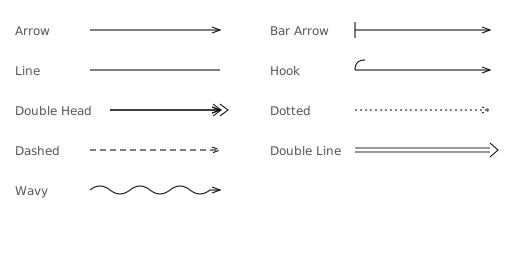
Choose from: Arrow, Bar Arrow, Line (no head), Hook, Double Head, Dotted, Dashed, Double Line, and Wavy.
Arrow Labels
Section titled “Arrow Labels”Each arrow can have up to three labels at different positions:
- Above — label sits above the arrow line
- Below — label sits below the arrow line
- Middle — label breaks the arrow line in the center
Click the + button in the Labels column to add a label. Each label has its own math editor for content and a position selector.
Curved Arrows
Section titled “Curved Arrows”For non-self-loop arrows, you can curve them up or down (with 3 levels of curvature). This is useful when two arrows go between the same pair of cells in opposite directions — curving one up and the other down keeps them from overlapping.
Self-Loop Arrows
Section titled “Self-Loop Arrows”When an arrow’s From and To are the same cell, it becomes a self-loop. Instead of Curve/Slide, you get direction pickers for the loop’s start and end points. Choose from 8 compass directions: ↑ ↗ → ↘ ↓ ↙ ← ↖.
Cell Frames
Section titled “Cell Frames”You can add a visual border around any cell by hovering over it and selecting a frame type:

Available frames: None, Rectangle, Double Rectangle, Oval, and Dotted.
Spacing
Section titled “Spacing”Click the gear icon (⚙) to adjust:
- Col Stretch — horizontal spacing between columns (40–240 px)
- Row Stretch — vertical spacing between rows (40–240 px)
Example: Commutative Square
Section titled “Example: Commutative Square”A classic commutative diagram with four objects and four arrows:
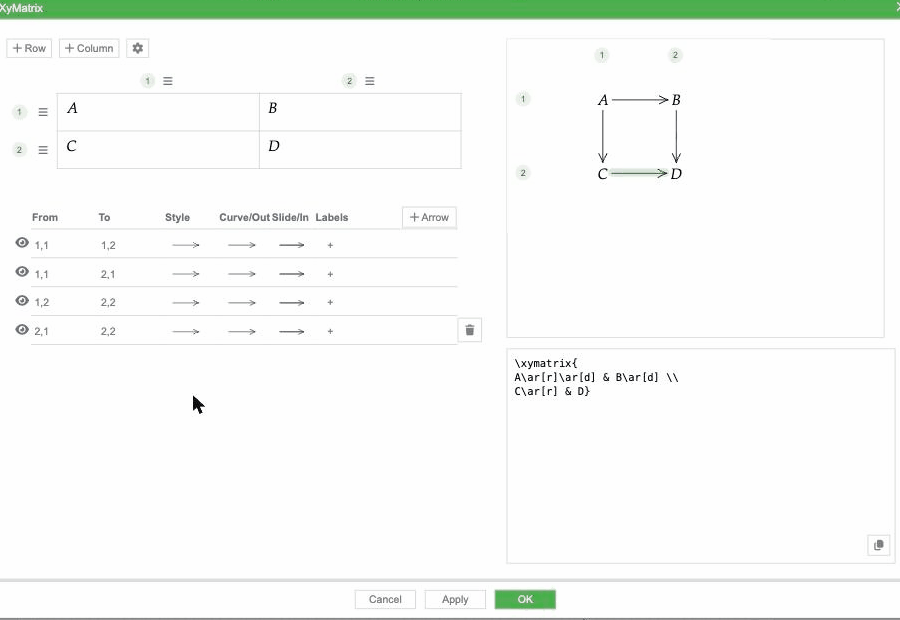
This can be created with a 2×2 grid, four arrows (A→B, A→C, B→D, C→D), and labels on each arrow.
LaTeX Source
Section titled “LaTeX Source”The dialog generates standard \xymatrix LaTeX code compatible with the XY-pic package. You can copy the source using the copy button in the bottom-right of the source area. The generated code can be used directly in LaTeX documents with the \usepackage[all]{xy} package.
Visibility Toggle
Section titled “Visibility Toggle”Each arrow has an eye icon on the left. Click it to hide an arrow temporarily without deleting it. This is useful when working with complex diagrams.